Forex MT4/MT5 Indicators Forex Indicators Download Free
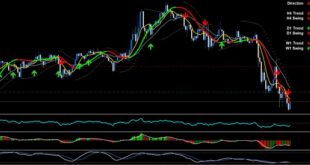
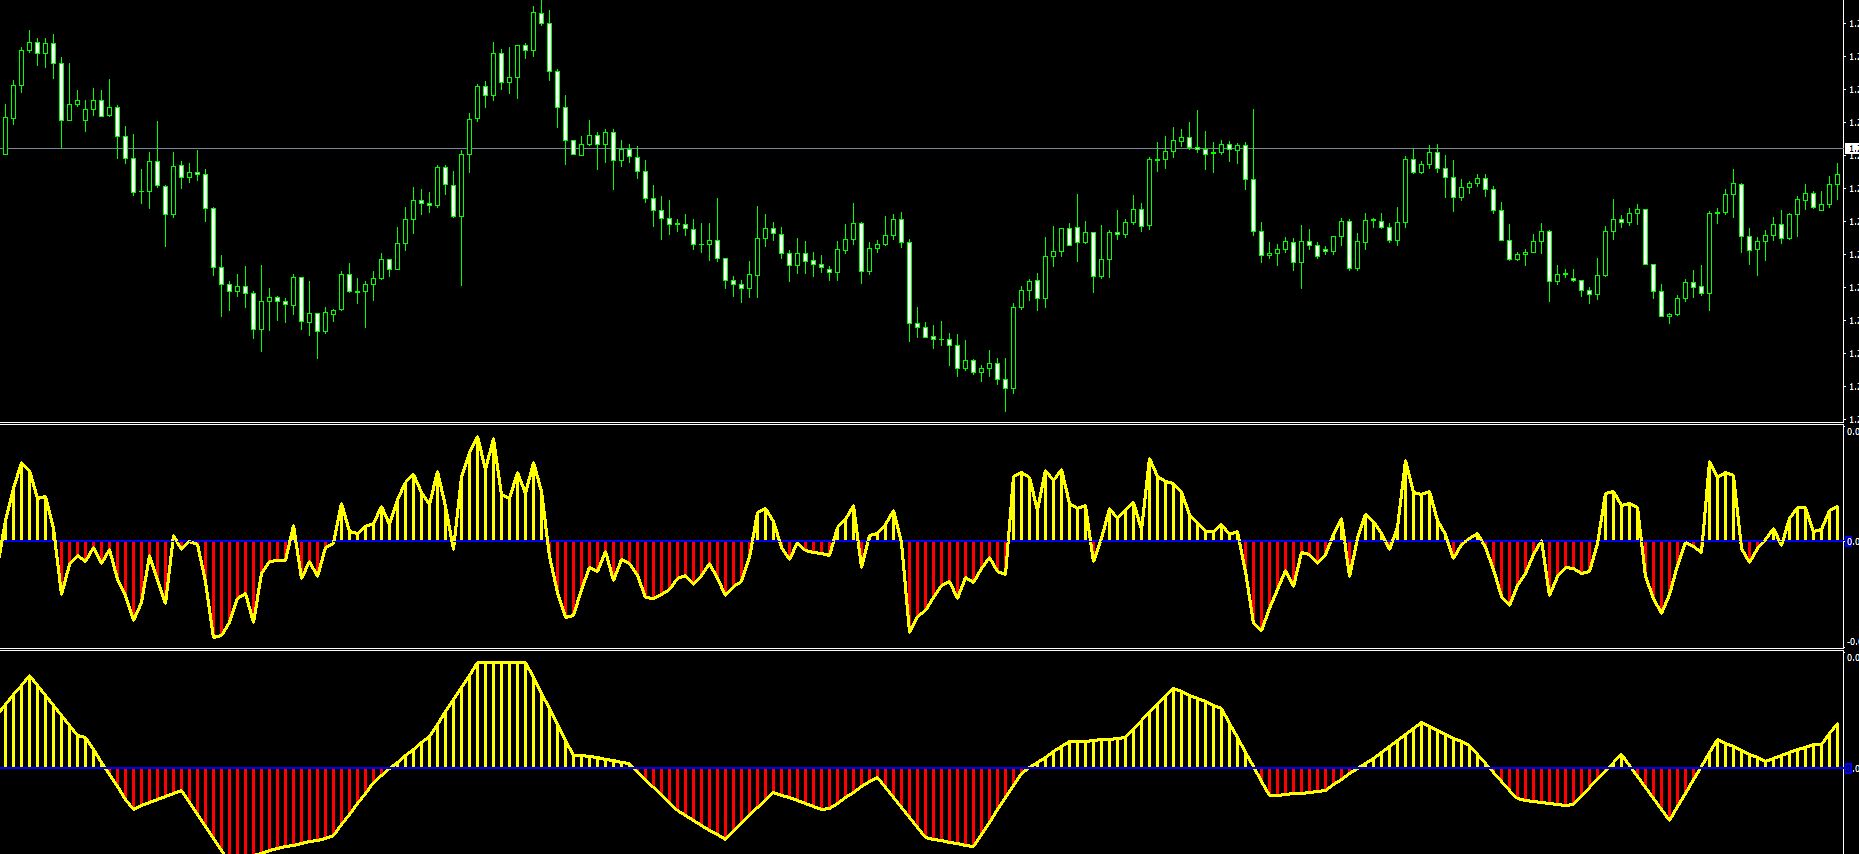
The MACD is a trend-following momentum indicator that shows the relationship between two moving averages of prices. The MACD is calculated by subtracting the 26-day exponential moving average (EMA) from the 12-day EMA. A nine-day EMA of the Indicator MACD, called the “signal line”, is then plotted on top of the MACD, functioning as a trigger for buy and sell signals.
MACD Settings 8,21,5 15 Minute Chart
MACD buy signals occur when the MACD line crosses above the signal line. MACD sell signals occur when the MACD line crosses below the signal line.
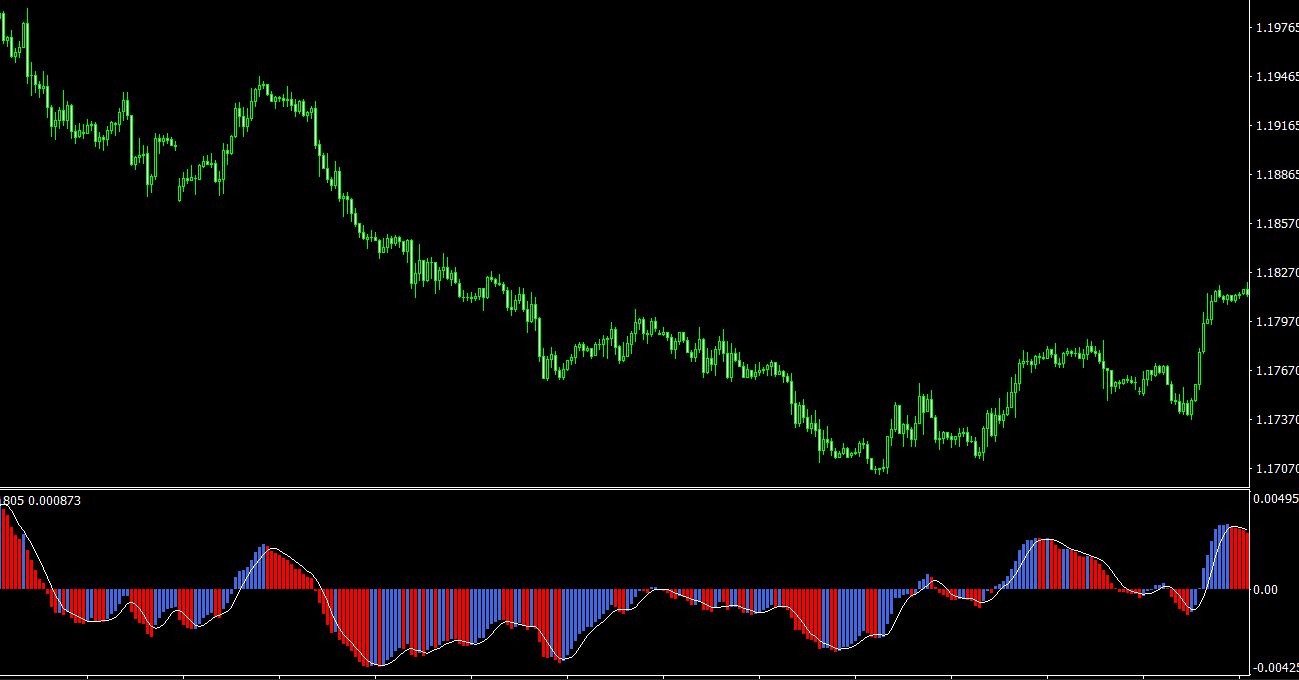
The MACD is a versatile indicator that can be used for trend trading and momentum trading.
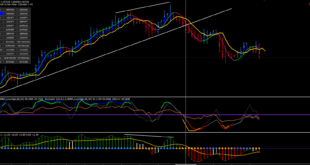
Best MACD Strategy for 15-Minute Charts
The MACD can be used to identify trend reversals by looking for divergences between the MACD line and price. A bullish divergence occurs when the MACD line Identify Trend is making higher lows while prices are making lower lows. This is an indication that the downward trend is losing momentum and a reversal to the upside is likely.
A bearish divergence occurs when the MACD line is making lower highs while prices are making higher highs. This is an indication that the upward trend is losing momentum and a reversal to the downside is likely.
Momentum Trading:
The MACD can also be used to trade momentum. MACD buy signals are generated when the MACD line crosses above the signal line.
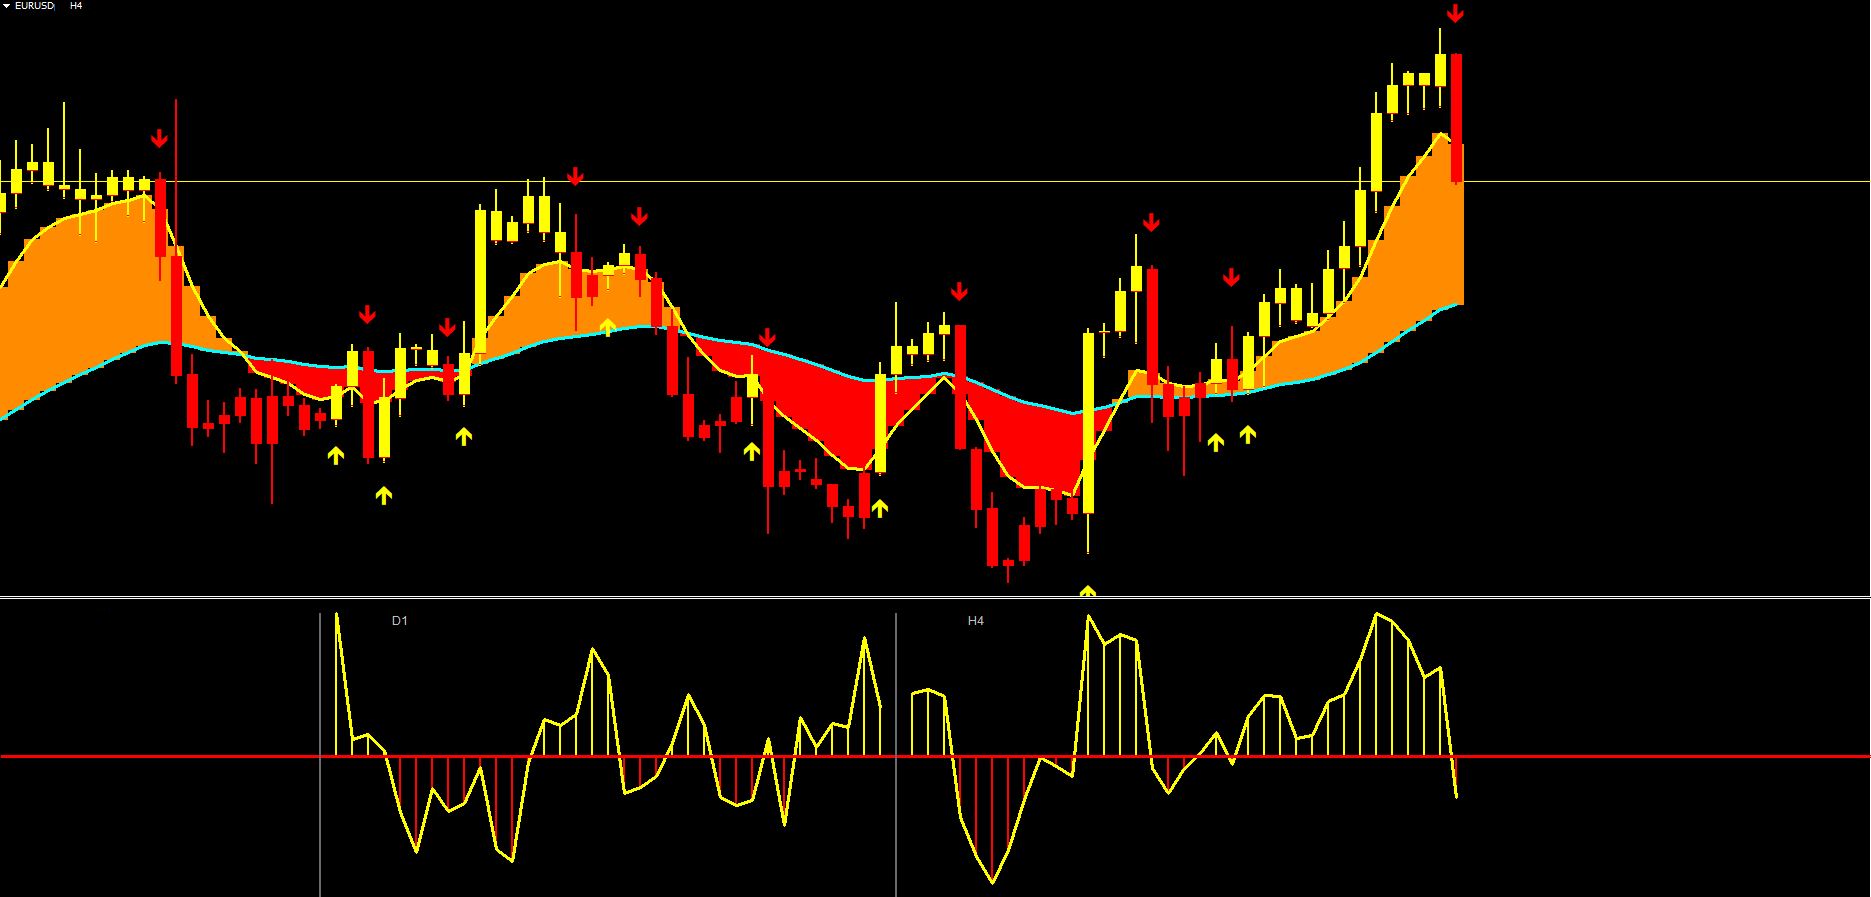

Opening and Closing Position 15 Minute Chart MT4
This is an indication that momentum is increasing to the upside. MACD sell signals are generated when the MACD line crosses below the signal line. This is an indicator that momentum is decreasing to the downside.
What are the Best MACD Settings for a 15 minute chart?
There are a number of different ways to configure the MACD indicator, but the most common setting is the 12, 26, 9 configuration. This is the configuration that is typically used on a 15-minute chart.
The MACD indicator is a momentum indicator that is used to identify the direction and strength of a trend. The indicator consists of two moving averages, a fast moving average (MA) and a slow moving average (MA).
The difference between the two moving averages is plotted as a histogram. The MACD histogram is used to generate buy and sell signals.
Buy Sell MACD Indicator Signal Order
The MACD indicator is calculated by subtracting the 26-period MA from the 12-period MA. The 9-period MA is then plotted as a signal line.
A buy signal is generated when the MACD line crosses ABCD Chart above the signal line. A sell signal is generated when the MACD line crosses below the signal line.
Scalping MACD Settings
The most common setting for the MACD indicator is the 12, 26, 9 configuration. This setting is typically used on a 15-minute chart. The 12-period MA Big Bull Strategy is used to identify the short-term trend, while the 26-period MA is used to identify the long-term trend. The 9-period MA is used as a signal line.