 Forex MT4/MT5 Indicators Forex Indicators Download Free
Trend trading involves following established trends in financial markets, as opposed to reversal trading that focuses on identifying when a trend is about to change.
By carefully examining indicator combinations, traders can unlock a wealth of possibilities and refine their forex trading approaches for optimal results.
Top 10 Trend Indicator for Day Trading List
- Moving Average: Moving averages are foundational indicators, widely used in various strategies, including trend trading. Traders often hold positions as long as the price remains above or below the moving average.
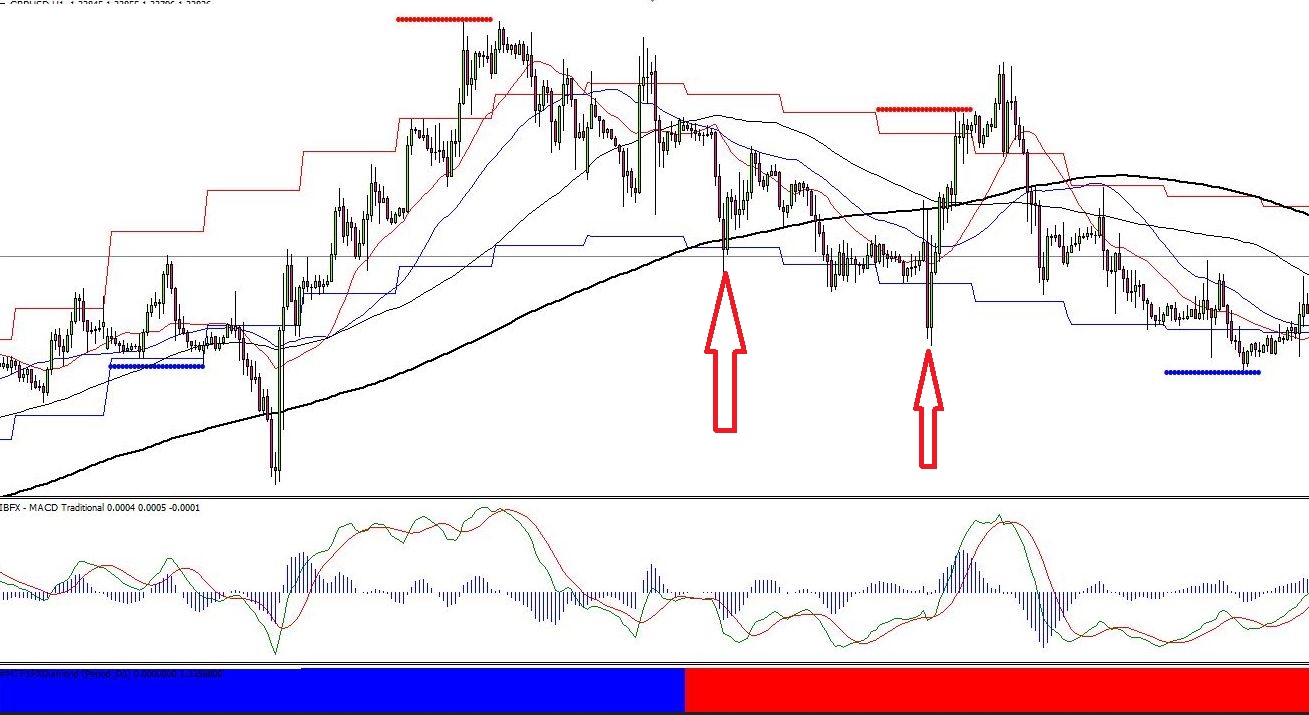
- MACD (Moving Average Convergence Divergence): MACD, derived from two moving averages, is popular for both trend following and reversal trading. Crossovers and the relationship between the lines provide signals for market direction.
- Relative Strength Index (RSI): A widely recognized oscillator, RSI Indicator Buy Sell, helps identify overbought and oversold conditions. In trend following, buy signals occur with upward RSI movement, while sell signals accompany downward movement.
- Bollinger Bands: moving averages and standard deviation, Bollinger Bands assist in trend following. During an uptrend, prices typically remain between the middle and upper bands, offering buy signals.
- Ichimoku Kinko Hyo: its complexity, Ichimoku Kinko Hyo is valued for its accuracy. Traders can use the Ichimoku cloud or lagging line to identify trends and reversals.
- Stochastic Oscillator: Identifying overbought and oversold levels, the Stochastic Oscillator provides buy and sell signals based on crossovers and directional movement.
- ADX (Average Directional Index): ADX gauges the strength of a trend, rising during bullish trends. Traders use it to assess trend strength, although it may sometimes produce false signals.
- Advance-Decline Line (ADL): Widely used for index trading, ADL measures the number of advancing and declining stocks. It indicates market breadth and potential weaknesses in a rally.
- On Balance Volume (OBV): Similar to ADL but focused on volume, OBV helps identify the strength of a trend by analyzing volume changes.
- Donchian Channels: Resembling Bollinger Bands, Donchian Channels provide buy and sell signals based on price movements within the channel, helping traders identify the beginning or end of trends.
Most Accurate Trend Indicator for Day Scalping
This indicator is designed specially to help forex traders to perform their tasks more effectively and easily. Successful traders often integrate various indicators and disciplines, leveraging proprietary tools to enhance their strategies.
As forex is one of the most rapidly growing field.


Successfully executed trend trading is considered the most effective strategy, enabling traders to profit over an extended period. traders are encouraged Candlestick Chart Patterns to think beyond the dichotomy of fundamental versus technical analysis.
This statistical suite ensures traders have access to historical data and predictive analytics, avoiding blind trading. This article explores various indicator Renko Street used in trend trading, emphasizing their significance for day trading. Forex is becoming the center of interest for many new traders and investors
Best Trend indicator for Entry and Exit
To engage in trend trading effectively, many traders rely on several technical indicators. This includes data on overall trades, profitable trades, success rates, and detailed profit analysis.
In this discussion, we will highlight the top nine indicators suitable for day trading. Indicator is designed to provide traders with the clarity and confidence needed to make informed decisions in the volatile Forex market.
Forex trading can help you to become a millionaire or atleast financially free in just a short time.
Trend Detector not only offers real-time market insights Trend Arrow Indicator but also presents a comprehensive statistical overview on its dashboard.

With its unique combination of trend detection, statistical analysis, and multi-timeframe compatibility, it emerges as a valuable tool for both novice and seasoned traders pursuing consistent success in their trading journey. Forex is getting alot of hype these days because of its amazing potential.
What are the best Day chart indicators for trading
Importance of Trend Indicators: Trend indicators play a crucial role in day trading for several reasons:
- Following the Trend: Trend indicators help traders effectively follow market trends. For instance, observing rising Apple shares above the 50-day moving average allows a trader to maintain a bullish trade.
- Exit Timing: Trend indicators aid in determining the optimal time to exit a trade. Using the moving average as an example, if the price falls below it during a long position, it signals an exit point.
- Buy or Short Decisions: Trend indicators assist in deciding 50 Pips A Day when to buy or short an asset. Strategies like the golden cross and death cross involving moving averages help identify opportune moments for buying or selling.
- Setting Stop-Loss and Take-Profit: Trend indicators guide traders in identifying suitable levels for placing stop-loss and take-profit orders. For instance, one might place a stop-loss at the 50-day or 25-day moving average.

These trend indicators empower traders to make informed decisions, contributing to successful trend trading strategies.
We hope that after going through this article your knowledge about this topic will be increased and you must have now been able to know about the impact of forex trading in market.


