 Forex MT4/MT5 Indicators Forex Indicators Download Free
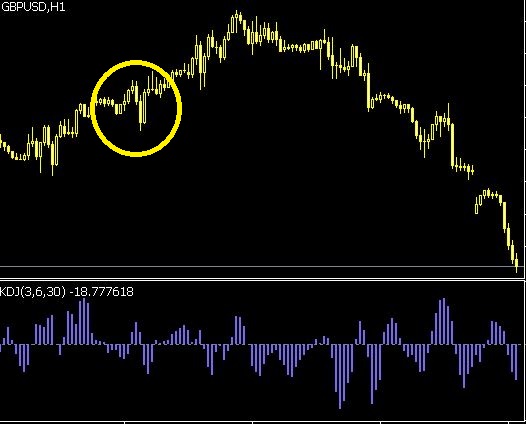
The KDJ indicator is based on the concept of the Stochastic Oscillator, which measures the current price relative to its recent high-low range.
However, unlike the Stochastic Oscillator which uses fixed time periods, the KDJ indicator adjusts dynamically according to market volatility, What is the best indicator with KDJ? making it more responsive and accurate.
How to use KDJ indicator
The KDJ indicator consists of three lines – the %K (blue), %D (red) and J (green) lines. The %K line represents the short-term price momentum, while the %D line reflects the longer-term trend.
The J line is essentially MT4 Chart Templates a smoothed version of %K and %D combined.
The calculation for each line involves finding three key components: highest high (HH), lowest low (LL) and closing price (CP). The formula can be written as:
KDJ indicator Formula
%K = ((CP – LL) / (HH – LL)) * 100
%D = SMA(%K)
J = 3 * %K – 2 * %D
As you can see, all three lines are dependent on one another, with J being derived from both %K and %D. This interconnectivity helps to smooth out any fluctuations or false signals in individual lines.
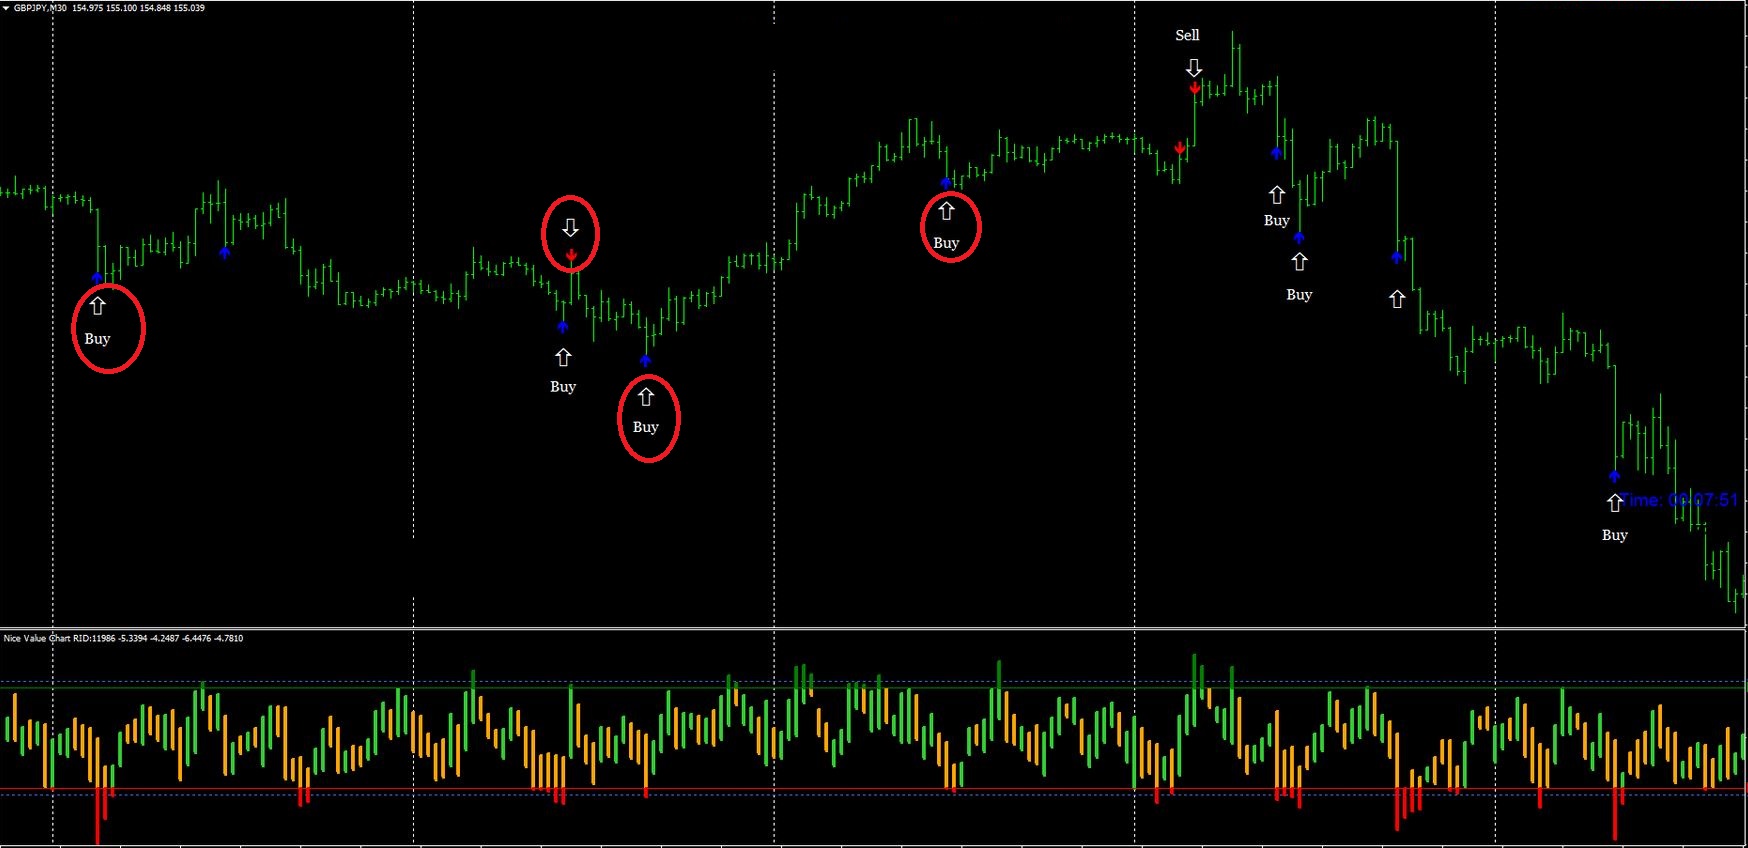
Buy Sell Signal KDJ Strategy
One of the main uses of the KDJ indicator is checking overbought and oversold conditions in markets. When either or both of the lines reach extreme levels such as above 80% or below 20%, it is considered an overbought or oversold signal, indicating a Indicator reversal in price direction.

Another important signal generated by the KDJ indicator is the divergence between price and %K or %D. Divergence occurs when there Pivot Point Strategy is a discrepancy between the direction of price movement and the momentum indicators, which can signal a trend reversal.
Furthermore, crossovers between %K and %D lines can also provide valuable insights into market trends. When the %K line crosses above or below the %D line, it is seen as a bullish or bearish signal respectively.
KT KDJ Indicator MT4
The KDJ indicator best for traders and investors check entry and exit points in financial markets. Its dynamic nature makes it suitable for various trading strategies and timeframes.
However, like any Perfect Trendline indicator, it should not be used in isolation but rather in conjunction with other tools to make informed trading decisions.
Step 1: Installing the KDJ Indicator
To use the KDJ indicator in MT4, you first need to install it on your trading platform. To do this, follow these simple steps:
- Open your MT4 platform and click on “File” from the top menu.
- Select “Open Data Folder” from the drop-down menu.
- A new window will open showing folders related to your MT4 installation.
- Look for the folder named “MQL4” and double-click on it.
- Now, open the “Indicators” folder and paste or drag-and-drop your downloaded KDJ indicator file into this folder.
- Close this window and go back to your MT4 platform.
- Click on “Insert” from the top menu and then select “Indicators”.
- Navigate to “Custom”, find your installed KDJ indicator, and double-click on it.


