Forex MT4/MT5 Indicators Forex Indicators Download Free
The Bollinger bands trading strategy is used to know the value of price levels. It tells that where the price value will high or low. The Bollinger bands trading is a market trading indicator that helps to point out the buy and sell signals, price up and price low levels and the market overbought and oversold conditions.
This strategy is used for short term trading purpose and can also be used for long term. The Bollinger band trading strategy is used for market exchange. This can be used with any forex trading strategy and with any type of currency pairs.
The Bollinger bands method are very popular for market trading. This strategy provides a very simple and easy calculation method for the market trading. There are a lot of indicators and trading strategies for the market trading.
100 Winning with Bollinger Band Indicator
Every indicator have different features and provide a unique benefit to the traders. But mostly the indicators are a little variation of the previous indicators or traditional indicators.
The Bollinger band indicator provides a concept and way of trading through bands. There are different bands that gives the trading results.
Bands concept
In the Bollinger band trading strategy the trades can know the price levels from wrong move by creating bands in the chart. This can be usable for short time and also for long timeframe. The bollinger bands shows all risky movements and increases the power of profit. The bands occurs when a trader takes a move for short or long time frame. The bands also keeps away the traders from wrong future price mevements and tells that at which point the price level is going high or low. The bands tells that either the market prices are coming in range or in the trend.
Key points
- The Bollinger band is a platform that provides the way of open and close points for market trading.
- This indicator helps the traders to know the overbought and oversold conditions in the market trading.
- If the traders use only bands for market trading then may be it can cause loss rather then profit. So don’t be depen on only bands.
- The online traders and professional traders can use this bands concept for market trading.
Bollinger Bands Settings for Scalping
Working
The Bollinger band trading is a trading indicator that is used to know the price levels. The Bollinger band trading indicator use bands for its working. For the price changes it uses bands and displays the result in the form of bands on the chart. When the trend is moving down the bands also moves down. There are two types of bands the lower band and the upper band. But some traders also use three type of bands such as lower band, upper band and the middle band. The price values depends on the movements of the bands.

Here is a short detail of these bands.
Upper band
The upper band is used to tell that the price is up. In simple words it tells that the prices are high and the trend is changed. If the price is nearest to the upper band then the trade is considered as expensive trade.

Lower band
The lower band is used to tell that the price is down. In simple words it tells that the prices are low and the trend has a weak change. If the price is nearest to the lower band then the trade is considered as cheap trade.
Middle band
The middle bands gives a base line for both the upper and lower bands.
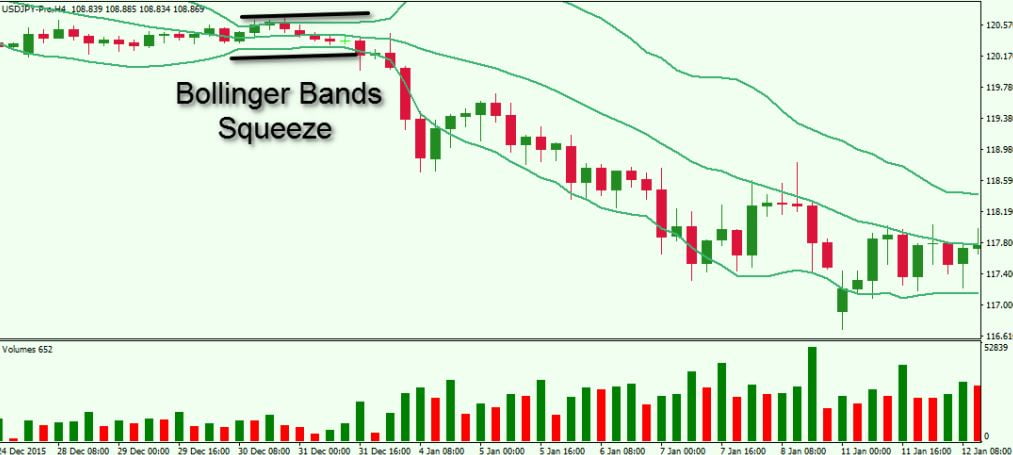
When the prices are became high then the distance between the bands is increases and when the prices become down then the uper and lower distance is compressed. When the trend is moving up then the trend also goes up. At every timeframe the bands of the indicator touches the price points. It tells the price changes on the chart around the band. The target band indicator can works with any forex strategy system.
Triple Bollinger Bands Reversal Strategy MT4
Calculation
The Bollinger bands are made up of with three bands. The upper band, lower band and the middle. So the calculation is also based on these three bands. The upper band takes the values and then send it to middle band then the middle band add these values in the lower band. Every band is depend on each other.
Here is a methamatical calculation for the calculation lf the Bollinger bands.
BOLU=MA(TP,n)+m∗σ[TP,n]
BOLD=MA(TP,n)−m∗σ[TP,n]
where:
BOLU=Upper Bollinger Band
BOLD=Lower Bollinger Band
MA=Moving average
TP (typical price)=(High+Low+Close)÷3
n=Number of days in smoothing period
m=Number of standard deviations
σ[TP,n]=Standard Deviation over last n periods of TP
RSI and Bollinger Bands Strategy PDF
Overbought and oversold
The Bollinger band trading indictor monitors that when a change in the price occurs at a specific time then it calculates the total price and defines the overbought and oversold market areas. This indicator calculates these changes by taking a number of period’s data and then displays the results. When the traders expect earn money then they buy low signal and sell the high signals. Mostly traders use this method for making money from the market trading.
Down Trend and up trend
When the trend is moving down then the sell signal occurs and the trader then only keeps interest on the sell signal.
When the trend is moving up then the buy signal occurs and the trader then only keeps interest on the buy signal.

Bollinger Bands and Moving Average Strategy PDF
Signal strength
The Bollinger band trading strategies did not provide exact and accurate signal. But round about it gives correct results. There are some signals can be produced through this indicator but it does not support more signals. The price levels can also be determined with the help of these signal. The signals displays different values on the chart of the price.
Stop loss level
The Bollinger band trading strategy is also identify a stop loss level. This level os identified with the help of the distance between the upper and lower bands. Usually it takes the distance in +1 and -1. The result of this distance is added into the upper band that generates the stop loss level. The traders mostly used it to save theri trade from risks. This factor helps the traders in their decision making that they should start long term trading or short term.