Forex MT4/MT5 Indicators Forex Indicators Download Free
Morning Star candlestick pattern for traders seeking to anticipate trend reversals and capitalize on potential market. This will take you on a journey through the intricacies of the Morning Star pattern, covering its essential components, methods of identification, trading strategies, variations, performance across diverse market conditions, and more.
How to Trad with Morning Star Candlestick Pattern Indicator
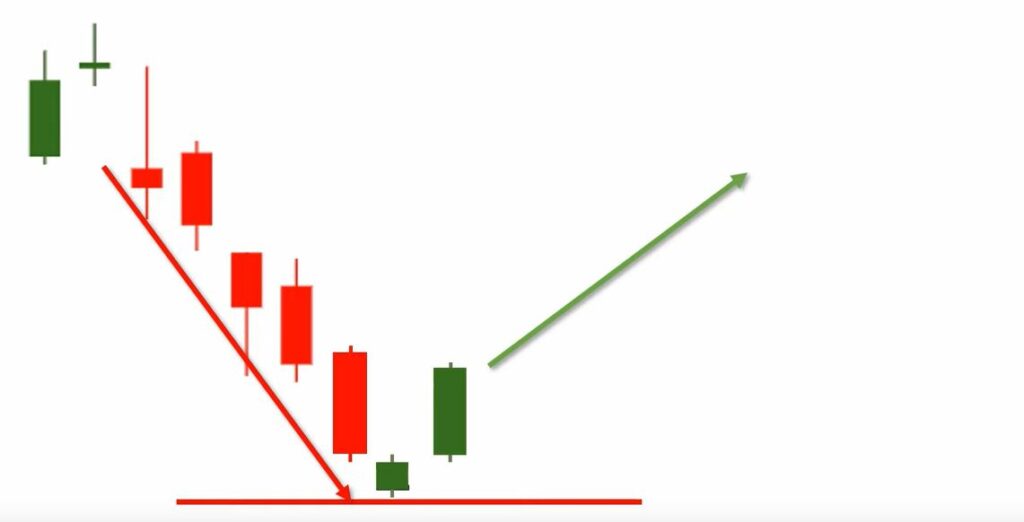
The Morning Star pattern is a bullish reversal formation that often appears at the conclusion of a downtrend, indicating a potential shift from bearish to bullish sentiment. Comprising a sequence of three distinct candlesticks, this pattern offers traders an early insight into potential trends and reversals.

The Morning Star pattern is a herald of change, a bullish reversal formation that often graces the end of a downtrend. This three-candle pattern serves as a beacon of hope for traders, hinting at a possible switch from bearish to bullish sentiment. Validating the Morning Star pattern as a reliable reversal signal involves historical data analysis. By examining Single Candlestick Patterns past instances of the pattern, traders can assess its consistency in accurately identifying trend reversals.
Morning Star Candlestick Pattern Backtest:
History serves as a lens through which we validate the Morning Star pattern as a reliable reversal signal. By delving into the annals of historical data, traders can gauge its effectiveness in identifying trend reversals accurately.
Components of the Morning Star Pattern:
- Bearish Candlestick: This opening act features a bearish candlestick, carrying the legacy of the preceding downtrend.
- Doji or Small Candlestick: A small, indecisive Doji Shooting Star Candlestick or a limited range candlestick takes center stage. This marks the market’s ambivalence and the potential for a shift.
- Bullish Candlestick: The curtain falls with a bullish candlestick, closing above the midpoint of the first candle. This is the crescendo of bullish momentum.
Regular Morning Star
The Regular Morning Star is a noteworthy variation of the Morning Star candlestick pattern, renowned for its ability to signal potential trend reversals in the financial markets. This three-candle pattern offers traders a clear insight into the transition from a downtrend Candlestick Pattern Marubozu to a potential uptrend. Let’s explore the components and significance of the Regular Morning Star pattern in detail.
The Regular Morning Star pattern begins with a bearish candlestick, representing the prevailing downtrend in the market. This candle signifies the dominance of bearish sentiment as sellers control the price action.
What type of trend does morning star signify?
The Regular Morning Star pattern’s significance lies in its ability to illustrate the shift in market sentiment from bearish to bullish. The bearish candlestick reflects the existing downtrend, followed by the Doji or small candlestick that indicates hesitation Candlestick PDF and a potential pause in the selling pressure.
The bullish candlestick that follows signifies the potential reversal of the downtrend as buyers start to regain control.


Morning Doji Star
The Morning Doji Star is a compelling variation of the Morning Star candlestick pattern, renowned for its ability to signal potential trend reversals in the financial markets. This distinctive pattern places a stronger emphasis on market indecision, making it a noteworthy for traders seeking to capitalize on shifts in sentiment. Let’s delve into the components and significance of the Morning Doji Star pattern. The Morning Doji Star variation initiates with a bearish candlestick, mirroring the ongoing downtrend.
The pattern concludes with a bullish candlestick that closes above the midpoint of the first bearish candlestick’s body. This bullish candle reinforces the potential reversal signaled by the Doji candle. The Morning Doji Star variation accentuates market uncertainty and the potential for a reversal. The bearish candlestick signifies the ongoing downtrend, followed by the Doji candlestick that underscores the indecision among traders.
Performance of the Morning Star Pattern in Different Market Conditions
The Morning Star candlestick pattern, renowned for its ability to signal potential trend reversals, exhibits varying degrees of effectiveness under different market conditions. Understanding how the pattern performs in different scenarios empowers traders to utilize it more judiciously.
Let’s explore the performance of the Morning Star pattern in bull markets, bear markets, and sideways markets

Bull Market
In a bull market, where prices are generally rising, the Morning Star pattern may hold slightly different implications. While it can still indicate a potential reversal, traders need to interpret its signals within the broader context.
The Morning Star pattern’s performance in a bull market is mixed. It might suggest a brief consolidation or a pause in the upward momentum before the uptrend resumes. In some cases, the pattern could even mark a minor correction or retracement.
Bear Market
In a bear market, characterized by prolonged ICT Asian Range price declines, the Morning Star pattern becomes particularly significant as it can signal potential trend reversals.
The Morning Star pattern’s performance is strongest in a bear market. It often indicates a potential end to the downtrend and the emergence of bullish sentiment. This reversal signal is more reliable due to the pattern’s ability to capture shifts in market sentiment. When the Morning Star pattern forms during a bear market, it’s often seen as a ray of hope for traders.

Sideways Market
In a sideways or range-bound market, where prices move within a horizontal range, the Morning Star pattern’s interpretation can be nuanced
. The Morning Star pattern’s performance in a sideways market is moderate. It can provide insights into potential trend reversals, but traders need to exercise caution due Butterfly Pattern to the lack of a clear trend direction. When encountering the Morning Star pattern in a sideways market, traders should consider the overall price range and other technical.
Is a morning star bullish or bearish?
The Morning Star pattern’s performance varies based on the prevailing market conditions. While it holds strong potential for signaling trend reversals in bear markets, its interpretation needs to be adjusted in bull and sideways markets.
Understanding how the pattern performs in different scenarios allows traders to apply it more effectively and make informed trading decisions. Regardless of the market condition, prudent traders will emphasize confirmation and integrate the Morning Star pattern with other technical analysis for enhanced accuracy.